East to West: Seoul and Footsie find support

A Twiggs Money Flow trough high above zero reflects strong buying support on the Seoul Composite Index. Breach of support at 2300 is unlikely but would signal a primary down-trend.

Seoul Composite Index

Japan’s Nikkei 225 Index broke resistance at 20200, signaling another advance.
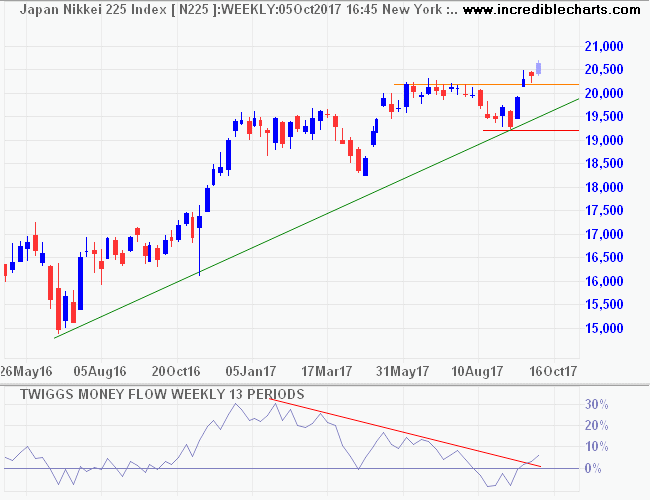
Nikkei 225 Index

Hong Kong’s Hang Seng Index has been in a strong bull market since breaking resistance at 24000 early this year.

Hang Seng Index

India’s NSE Nifty Index displays strong buying pressure, with Twiggs Money Flow oscillating above the zero line. Breakout above resistance at 10000/10100 is likely and would signal another advance.

Nifty Index

Target 10000 + ( 10000 – 9000 ) = 11000

Moving to Europe, Dow Jones Euro Stoxx 50 is headed for a test of resistance at 3650. A big Twiggs Money Flow trough above zero signals buying pressure. Breakout is likely and would offer a target of 3900*.

DJ Euro Stoxx 50

* Target calculation: 3650 + ( 3650 – 3400 ) = 3900

The UK’s Footsie is rallying strongly after a bear trap at 7300. Often the strongest bull signals start with a bear trap or false break through support. breakout above 7550 would offer a target of 7900*.

FTSE 100

* Target calculation: 7550 + ( 7550 – 7200 ) = 7900

India & Singapore

India’s Sensex found short-term support at 16000, but 21-day Twiggs Money Flow below zero indicates continued selling pressure. Breach of 16000 would test the band of primary support at 15000.

BSE Sensex Index

The Nifty similarly found short-term support at 4800, but 63-day Twiggs Momentum below zero warns of a continuing primary down-trend. Failure of the 4800 level would test primary support at 4500.

NSE Nifty Index

Dow Jones Singapore Index found short-term support at 222 — the 61.8% Fibonacci level. Expect a rally to test 230 but respect would warn of a decline to test primary support at 203. 63-Day Twiggs Momentum crossed below zero, warning of a primary down-trend.

Dow Jones Singapore Index

India & Singapore

India’s Sensex broke the 61.8% Fibonacci level at 16500, indicating a test of primary support at 15000. Reversal of 13-week Twiggs Money Flow below zero warns of strong selling pressure. Failure of support at 15000 would offer a target of 12000*.

BSE Sensex Index

* Target calculation: 15 – ( 18 – 15 ) = 12

The Nifty is similarly headed for a test of primary support at 4500. Failure would confirm the primary down-trend indicated by 63-day Twiggs Momentum reversal below zero.

NSE Nifty Index

Singapore’s Straits Times Index broke medium-term support at 2900. The primary trend is still up but expect a test of support at the rising trendline (2800). Failure of support and reversal of 63-day Twiggs Momentum below zero would both warn of a primary down-trend.

Singapore Straits Times Index

Dow Jones Singapore Index is similarly testing medium-term support at 230. Failure would indicate a test of the primary level at 210. Declining 13-week Twiggs Money Flow warns of medium-term selling pressure; reversal below zero would have long-term implications.

Dow Jones Singapore Index

India & Singapore

India’s Sensex is testing support at 16500 (61.8% Fibonacci retracement). Recovery above 17500 would signal the start of a fresh primary advance. Reversal of 13-week Twiggs Money Flow below zero, however, warns of strong selling pressure. Failure of support at 16500 would test the band of primary support above 15000.

BSE Sensex Index

The Nifty is similarly testing support at 5000. Reversal of 63-day Twiggs Momentum below zero warns that the primary down-trend will continue, but recovery above the descending trendline at 5200 would indicate that the correction is over.

NSE Nifty Index

Singapore’s Straits Times Index fell sharply to test medium-term support at 2900. Failure would indicate a correction to the rising trendline. Respect of support, especially if strengthened by a 63-day Twiggs Momentum trough above zero, would signal the start of a fresh primary advance.

Singapore Straits Times Index

* Target calculation: 2900 + ( 2900 – 2600 ) = 3200

India & Singapore find support

India’s Sensex index found support at 17000. Recovery above 17500 would indicate respect of the support level and another attempt at 18500.  63-Day Twiggs Momentum oscillating above zero already indicates a primary up-trend but only recovery above the November high of 18000 would confirm. Target for an advance would be 20000*.

BSE Sensex Index

* Target calculation: 18.5 + ( 18.5 – 17.0 ) = 20.0

The Nifty index is similarly testing support at 5200, while recovery above 5400 would confirm the primary up-trend. Target for an advance would be 6000*.

NSE Nifty Index

* Target calculation: 5600 + (5600 – 5200) = 6000

Singapore’s Straits Times Index continues in a narrow consolidation above the double-bottom neckline at 2900, suggesting continuation of the primary up-trend. Target for the expected breakout would be 3200*.

Singapore Straits Times Index

* Target calculation: 2900 + ( 2900 – 2600 ) = 3200

Australia and Asia

Australia’s ASX 200 index continues to range between 3850 and 4350. Declining 21-day Twiggs Money Flow reflects medium-term selling pressure, but the long-term rise reflects buying support. Failure of support at 4000 would suggest another test of 3850, but only breakout from the range will offer a clear long-term signal.

ASX 200 Index


China’s Shanghai Composite index respected resistance at 2300, suggesting a decline to 2000*. Deep negative values on 63-day Twiggs Momentum are evidence of a strong primary down-trend.

Shanghai Composite Index

* Target calculation: 2150 – ( 2300 – 2150 ) = 2000

India’s Nifty Index is headed for a test of the upper border of its downward trend channel at 5200. 63-Day Twiggs Momentum holding below zero continues to indicate a strong primary down-trend.

S&P/NSE Nifty Index

* Target calculation: 5600 + ( 6600 – 5600 ) = 5100

Japan’s Nikkei 225 Index fell sharply Monday to test short-term support at 8360. 13-Week Twiggs Money Flow below zero indicates selling pressure. Breakout below 8200 would warn of another primary decline, with a target of 7400*.

Nikkei 225 Index

* Target calculation: 8200 – ( 9000 – 8200 ) = 7400

India NIFTY and Singapore Straits Times Index

India’s NIFTY index continues its primary down-trend, breaking support at 4700 on the weekly chart. 63-Day Twiggs Momentum holding below zero confirms the down-trend. Target for the primary decline is 4000*.

NSE NIFTY Index

* Target calculation: 4700 – (5400 – 4700 ) = 4000

The Straits Times Index also shows 63-day Twiggs Momentum declining below zero, suggesting a primary down-trend. Respect of the descending trendline on the weekly chart strengthens the signal.  Breakout below primary support at 2500 would offer a target of 2100*.

Straits Times Index

* Target calculation: 2500 – ( 2900 – 2500 ) = 2100