East to West: Trade tariff fears

Plenty of red ink as Trump’s threat of trade tariffs spooked global markets, with fears of a global trade war.

China’s Shanghai Composite Index is headed for a test of primary support between 3000 and 3060 with a falling Trend Index warning of strong selling pressure.

Shanghai Composite Index

South Korean investors are more spooked by Trump’s trade tariffs than Kim Jong-un’s nukes. The Seoul Composite Index retreated below support at 2450, while bearish divergence on the Trend Index warns of strong selling pressure. Breach of 2350 would signal a primary down-trend. Breach of 2300 would confirm.

Seoul Composite Index

Japan’s Nikkei 225 Index is falling hard. Breach of support at 21000 offers a target of the September 2017 low at 19250.

Nikkei 225 Index

India’s NSE Nifty Index is testing primary support at 10000.

Nifty Index

Europe is in the same basket, with Dow Jones Euro Stoxx 600 testing primary support at 365.

DJ Euro Stoxx 600

The Footsie broke primary support at 7100 to signal a primary down-trend.

FTSE 100

In the US, the Nasdaq 100 is likely to test primary support at 6200 but this looks like a secondary correction, with the Trend Index still positive.

Nasdaq 100

The S&P 500 is similarly headed for a test of primary support between 2500 and 2550. Breach would signal a primary down-trend but Twiggs Volatility Index is currently in the amber zone, between 1% and 2%, suggesting that the correction is secondary in nature. For more on the Volatility Index, see Market Volatility and the S&P 500.

S&P 500

Canada’s TSX 60 also signals strong selling pressure. Breach of 880 would signal a primary down-trend.

TSX 60

As the market flees from risk, two of the traditional safe havens — the Dollar and the Japanese Yen — are under threat from a trade war. Which leaves Gold as the last man standing.

East to West: S&P 500 strengthens

Japan’s Nikkei 225 Index continues to test its rising trendline and support at 21000, with resistance forming at 22000. A Trend Index peak below zero warns of medium-term selling pressure.

Nikkei 225 Index

India’s NSE Nifty Index has had a strong bull run, with Trend Index troughs above zero. But now the Index is heading for a test of primary support at 10000, warning of slowing momentum.

Nifty Index

South Korea’s Seoul Composite Index remains bearish after breaking support at 2450.

Seoul Composite Index

Likewise China’s Shanghai Composite Index found resistance at 3300.

Shanghai Composite Index

Hong Kong’s Hang Seng Index is the pick of the East, with a long run of Trend Index troughs above zero. Breakout above 32000 would signal a fresh advance.

Shanghai Composite Index

In Europe, DJ Euro Stoxx 600 is struggling with resistance at 380/385 while bearish divergence on the Trend Index warns of selling pressure.

DJ Euro Stoxx 600

The Footsie is similarly headed for another test of resistance at 7300 but bearish divergence on the Trend Index warns of selling pressure.

FTSE 100

In the US, the S&P 500 is testing medium-term resistance at 2800. The difference is that a Twiggs Money Flow trough at zero warns of buying pressure. Breakout above 2800 is likely, bringing the long-term target of 3000* within reach.

S&P 500

* Target calculation: log scale 750 x 2 = 1500; 1500 x 2 = 3000

Canada’s TSX 60 is recovering. Breakout above 940 would suggest another advance.

TSX 60

Patience is required to weather the volatility of the next few weeks without making short-term decisions.

East to West: Caution

Markets settled after the sharp fall of the previous week but a hint of caution was evident, with buyers wary of being caught by an after-shock. It should take several weeks for sentiment to settle back into a semblance of normal routine.

Short candles were common, as on South Korea’s Seoul Composite Index, with buyers displaying a lack of enthusiasm.

Seoul Composite Index

The long tail on Japan’s Nikkei 225 Index reflects buyer support but the large overlap with the previous candle suggests hesitancy.

Nikkei 225 Index

China’s Shanghai Composite Index likewise displays a short candle below the new resistance level at 3250.

Shanghai Composite Index

After a strong bull run India’s NSE Nifty Index is surprisingly hesitant. A close below the rising trendline would signal a test of primary support at 10000.

Nifty Index

DJ Euro Stoxx 600 shows a stronger blue candle but is still testing resistance at 380.

DJ Euro Stoxx 600

The Footsie shows a similar pattern, with resistance at 7300.

FTSE 100

In the US, bellwether transport stock Fedex respected support at 230. Follow-through above 250 is likely and would signal resumption of the up-trend, a bullish sign for the economy.

S&P 500

Canada’s TSX 60 respected primary support at 880. Recovery above 920 is likely and would indicate a test of 940.

TSX 60

Patience is required to weather the uncertainty of the next few weeks without making knee-jerk decisions.

East to West: Sweeping conflagration

The tinder was dry and all it took was a spark from the US to set off a sweeping conflagration across global stock markets.

South Korea’s Seoul Composite Index broke support at 2450. Technically, Dow Theory requires a lower high followed by a new low to signal a reversal. What we have is a new low, without a preceding lower high. Often described as large correction, there has been debate over the years as to whether this constitutes a valid reversal. I prefer to sit on the fence: follow-through below 2300 would confirm reversal to a primary down-trend, while recovery above 2450 would signal a false alarm.

Seoul Composite Index

Japan’s Nikkei 225 Index remains in a primary up-trend, though retreat below the rising trendline at 21000 would warn of a loss of momentum.

Nikkei 225 Index

China’s Shanghai Composite Index was also hit hard. Primary support at 3250 has been breached but again by a large correction. Follow-through below 3000 would confirm the reversal.

Shanghai Composite Index

India’s NSE Nifty Index remains bullish, with Trend Index troughs above zero signaling long-term buying pressure. Breach of primary support at 10000 is unlikely.

Nifty Index

Target 10500 + ( 10500 – 10000 ) = 11000

In Europe, the DJ Euro Stoxx 600 is testing primary support at 366. Bearish divergence on the Trend Index warns of long-term selling pressure.

DJ Euro Stoxx 600

The Footsie retreated below two primary support levels, at 7300 and 7200, confirming reversal to a primary don-trend. Bearish divergence on the Trend Index warns of long-term selling pressure.

FTSE 100

In the US, it is hard to identify primary support levels as there has not been a decent correction for some time. Breach of support at 6200 appears unlikely, with Trend Index troughs above zero signaling long-term buying pressure.

S&P 500

While Canada’s TSX 60 is testing its primary level at 880. Again this is a large correction, so we may need to look elsewhere for confirmation if support at 880 is breached.

TSX 60

The extent of the market reaction reflects high levels of fear from investors. Valuations are high, especially in the US, and the emphasis has quickly swung to protecting existing profits and away from further gains.

East to West: Global correction

There are clear signs that global stock markets are headed for a correction.

South Korea’s Seoul Composite Index followed a false break above its November high of 2560 with a sharp reversal. Bearish divergence on the Trend Index warns of selling pressure.

Seoul Composite Index

Japan’s Nikkei 225 Index remains bullish but shows strong resistance at 24000.

Nikkei 225 Index

A large engulfing candle on China’s Shanghai Composite Index warns of a correction. Breach of support at 3400 would test the primary level at 3250.

Shanghai Composite Index

India’s NSE Nifty Index also displays an engulfing candle at resistance of 11000*, warning of a correction. Trend Index troughs above zero, however, continue to signal long-term buying pressure.

Nifty Index

Target 10500 + ( 10500 – 10000 ) = 11000

In Europe, the DJ Euro Stoxx 600 penetrated its rising trendline at 390, warning of a loss of momentum. Strong bearish divergence on the Trend Index warns of a primary down-trend. Reversal below 380 would strengthen the signal.

DJ Euro Stoxx 600

The Footsie retreated below its new support level at 7600. Reversal below 7300 would signal a primary down-trend.

FTSE 100

In the US, the daily chart for the S&P 500 reveals market skittishness about higher inflation and interest rates.

S&P 500

While Canada’s TSX 60 ended its 4-month rally with an emphatic red candle breaking support at 940. Expect a test of the primary level at 880.

TSX 60

This looks like a global correction but it would be premature to call this a market top.

East to West: Time to take the punch bowl away

Crude oil is retracing and a Nymex Light test of $60/barrel would take some of the heat out of the commodities market. A rising rig count in the US may help to increase supply and ease oil prices.

Nymex Light Crude

Political tensions remain high, with the Turks bombing Kurd-controlled territory in Syria, Iran proxies in Yemen firing missiles at Saudi Arabia, North Korea showing no signs of caving to sanctions pressure over its nuclear weapons program, and Russia fomenting tensions in the Balkans between Serbia and Kosovo.

Stock markets shrugged off the usual conga-line of autocrats behaving badly, instead focusing on signs of a reviving global economy. South Korea’s Seoul Composite Index is headed for a test of resistance at its November high of 2560. Respect of the rising trendline is bullish but the latest Trend Index rally is weak and a bearish divergence may be forming.

Seoul Composite Index

Japan’s Nikkei 225 Index remains bullish. A Trend Index trough high above zero indicates strong buying pressure.

Nikkei 225 Index

China’s Shanghai Composite Index broke resistance at its November high of 3450 to signal another primary advance.

Shanghai Composite Index

India’s NSE Nifty Index is advancing toward its target of 11000*. Trend Index troughs above zero signal long-term buying pressure.

Nifty Index

Target 10500 + ( 10500 – 10000 ) = 11000

In Europe, the DJ Euro Stoxx 600 broke resistance at 396. Trend Index recovery above the declining trendline indicates buyers are back in control.

DJ Euro Stoxx 600

The Footsie met short-term resistance at 7800 and is likely to retrace to test its new support level at 7600. Trend Index recovery above the declining trendline again indicates buyers have taken control.

FTSE 100

Moving to the US, the Dow chart says it all. Investors continue to shrug off concerns about high valuations as the up-trend accelerates. The few corrections over the last 12 months have been both mild and of short duration. A rising Trend Index, with troughs high above zero, indicates strong buying pressure. It is important to remain objective, focus on the long-term, and not to get caught up in the euphoria. Heady gains like this inevitably lead to a sharp blow-off. The question is: when?

Dow Jones Industrial Average

Right now it seems the rocket has plenty of fuel, with tax cuts expected to stimulate both buybacks and new capital investment, while a falling US Dollar should boost US manufacturer’s competitiveness both at home and abroad. A sharp reversal could be many months away.

It’s time that the Fed took the punch bowl away, to calm things down before the party really gets out of hand.

East to West: Global stocks rally

In Asia, South Korea’s Seoul Composite Index found support at 2450 but be careful of a bearish divergence forming on Twiggs Trend Index. Reversal below zero would warn of a test of primary support at 2300.

Seoul Composite Index

Japan’s Nikkei 225 Index remains bullish. Trend Index troughs high above zero indicate strong buying pressure.

Nikkei 225 Index

China’s Shanghai Composite Index found support at 3250. Breakout above 3450 would signal a primary advance.

Shanghai Composite Index

India’s NSE Nifty Index broke resistance at 10500, signaling a fresh advance. Trend Index troughs above zero signal buying pressure. The immediate target is 11000*.

Nifty Index

Target 10500 + ( 10500 – 10000 ) = 11000

In Europe, the Footsie is advancing strongly after breaking through resistance at its June high of 7600. Trend Index is still declining but recovery above the declining trendline indicates buyers are taking control.

FTSE 100

Europe, represented by the DJ Euro Stoxx 600, remains weak. A declining Trend Index warns of selling pressure despite breakout above resistance at 396.

DJ Euro Stoxx 600

Moving to the US, the S&P 500 chart says it all. Investors continue to shrug off concerns about high valuations. The rising Trend Index, high above zero, indicates strong buying pressure. We need a correction fairly soon to prevent an accelerating up-trend leading to a blow-off.

S&P 500

Commodities are also advancing, led by stronger crude oil prices.

Nymex Light Crude

It’s about time that the Fed and other central banks took the punch bowl away, before the party really gets out of hand.

East to West: Footsie surprise

The Footsie is testing resistance at its June high of 7600. Trend Index is still declining but recovery above 0.2% would indicate buyers are taking control.

FTSE 100

Europe is weaker, with tall shadows on weekly Dow Jones Euro Stoxx 600 candles and a declining Trend Index warning of selling pressure.

DJ Euro Stoxx 50

In Asia, South Korea’s Seoul Composite Index broke support at 2450, confirming the bearish divergence on Twiggs Trend Index. Expect a correction to test primary support at 2300.

Seoul Composite Index

Japan’s Nikkei 225 Index remains bullish, consolidating in a narrow band below resistance at 23000. Trend Index troughs high above zero indicate strong buying pressure.

Nikkei 225 Index

China’s Shanghai Composite Index found short-term support at 3250. Bearish divergence on the Trend Index warns of selling pressure.

Shanghai Composite Index

India’s NSE Nifty Index is testing resistance at 10500 after a mild correction to 10,000. Twiggs Trend Index respecting zero signals strong buying pressure. Breakout above 10500 is likely and would indicate another primary advance with an immediate target of 11000*.

Nifty Index

Target 10500 + ( 10500 – 10000 ) = 11000

Moving to the US, the S&P 500 continues to shrug off concerns over high valuations and a flattening yield curve. The rising Trend Index, high above zero, indicates long-term buying pressure.

S&P 500

Bellwether transport stock Fedex has advanced to 250, signaling strong economic activity, a bullish sign for the entire economy.

Nasdaq 100

East to West: Asia, Europe weaken but US powers on

Starting with Asia, South Korea’s Seoul Composite Index continues to test support at 2450. Bearish divergence on the Trend Index warns of selling pressure but this appears secondary in nature. Breach of the rising trendline would warn that the primary up-trend is losing momentum.

Seoul Composite Index

Japan’s Nikkei 225 Index is consolidating between 22000 and 23000. A Trend Index trough high above zero indicates strong buying pressure.

Nikkei 225 Index

China’s Shanghai Composite Index is undergoing a correction that should find support at 3200. Bearish divergence on the Trend Index, and a cross below zero for the first time since May 2016, warn of continued selling pressure.

Shanghai Composite Index

India’s NSE Nifty Index continues to test support at 10000 after a weak correction. Twiggs Trend Index respecting zero signals strong buying pressure. Recovery above 10500 is likely and would indicate another primary advance.

Nifty Index

Target 10500 + ( 10500 – 10000 ) = 11000

Europe is weaker despite strong manufacturing signals. Dow Jones Euro Stoxx 50 found support at 3520 but the Trend Index is declining, warning of selling pressure. Breach of 3520 is likely and would warn of a test of primary support at 3400.

DJ Euro Stoxx 50

The Footsie remains volatile, with the index headed for another test of stubborn resistance at 7600. But Trend Index is declining and continues to warn of selling pressure.
FTSE 100

Moving to the US, the S&P 500 continues to shrug off concerns regarding high valuations and a flattening yield curve. The rising Trend Index, high above zero, indicates long-term buying pressure.

S&P 500

The Nasdaq 100 also continues a strong bull market, with the big five tech stocks (Apple, Amazon, Alphabet, Microsoft and Facebook) all recording solid gains.

Nasdaq 100

East to West: Europe steadies, S&P powers on

Dow Jones Euro Stoxx 600 found support at 380 and is now headed for a test of recent highs at 395. Bearish divergence on the Trend Index continues to warn of selling pressure but recovery above the declining trendline (on the Trend Index) would indicate that pressure has eased. Breakout above 395 would signal another primary advance, with a target of 425*.

DJ Euro Stoxx 600

Target 395 + ( 395 – 365 ) = 425

Conclusion of phase I of Brexit negotiations helped the Footsie find support at 7300. Trend Index continues to warn of selling pressure. Breach of 7200 is unlikely at present but would signal a primary down-trend. Breakout above 7600 would signal a primary advance, but is also unlikely. Expect further consolidation.

FTSE 100

In Asia, South Korea’s Seoul Composite Index is undergoing a correction but seems to have found support at 2450. Respect of the rising trendline would confirm the primary up-trend.

Seoul Composite Index

Japan’s Nikkei 225 Index found solid support at 22000, with long tails signaling buyer enthusiasm. The trend index trough high above zero indicates strong buying pressure.

Nikkei 225 Index

China’s Shanghai Composite Index is undergoing a correction. A long tail suggests support at 3250. Bearish divergence on the Trend Index warns of selling pressure but this appears to be secondary in nature.

Shanghai Composite Index

India’s NSE Nifty Index found support at 10000 after a weak correction. Recovery above 10500 is likely and would warn of another primary advance.

Nifty Index

Target 10500 + ( 10500 – 10000 ) = 11000

In the US, the S&P 500 continues to shrug off concerns regarding high valuations and a flattening yield curve. The rising Trend Index indicates buying pressure.

S&P 500

The Nasdaq 100 continues its strong bull market, powered by the big five tech stocks (Apple, Amazon, Alphabet, Microsoft and Facebook). Corrections are mild and of short duration, typical of the latter stages of a bull market.

Nasdaq 100

East to West: European tremors

Complacency in Europe has been shaken, with Dow Jones Euro Stoxx 600 testing medium-term support at 380. Bearish divergence on the Trend Index, with intervening troughs below zero, warns of strong selling pressure. Breach of 380 is likely and would indicate a test of primary support at 366.

DJ Euro Stoxx 600

The UK’s Footsie broke medium-term support at 7350 and is headed for a test of primary support at 7200. Bearish divergence on the Trend Index again warns of strong selling pressure. Breach of 7200 would signal reversal to a primary down-trend.

FTSE 100

Asia was also affected, with Japan’s Nikkei 225 Index the only major index to end the week on a positive note, after finding solid support at 22000.

Nikkei 225 Index

South Korea’s Seoul Composite Index below 2500 warns of a correction, though nothing more.

Seoul Composite Index

China’s Shanghai Composite Index broke support at 3340 to warn of a correction. Bearish divergence on the Trend Index warns of selling pressure but this appears to be secondary in nature.

Shanghai Composite Index

India’s NSE Nifty Index is still bullish but reversal below 10000 would warn of a strong correction.

Nifty Index

Target 10000 + ( 10000 – 9000 ) = 11000

The S&P 500 is as bear-proof as you can get in the current climate, with the trend index reflecting strong buying pressure.

S&P 500

A bear market in Europe may not be sufficient to dent the animal spirits driving US markets but would certainly influence more cautious investors to change to a risk-off stance and shorten the time left for more adventurous souls.

East to West: China sell-off

Four markets worth our attention this week:

China’s Shanghai Composite Index displays strong selling pressure, testing medium-term support at 3340. Breach of support is likely and would warn of a strong correction, with an immediate target of 3200.

Shanghai Composite Index

India’s NSE Nifty Index displays strong support at 10000. Recovery above 10500 would signal an advance to 11000.

Nifty Index

Target 10000 + ( 10000 – 9000 ) = 11000

Moving to Europe, Dow Jones Euro Stoxx 600 found medium-term support at 380. Bearish divergence on the Trend Index warns of selling pressure. Breach of support at 380 would be a strong bear signal but respect of the rising trendline is more likely and recovery above the recent high would signal a fresh advance.

DJ Euro Stoxx 600

The UK’s Footsie found support at 7350 but bearish divergence on the Trend Index warns of long-term selling pressure. Breakout above 7550 is unlikely at this stage.

FTSE 100

East to West: Still mostly bullish apart from EU & China

South Korea’s Seoul Composite Index continues in a strong up-trend despite the nuclear threat from its northern neighbor. The latest retracement appears mild and likely to test the rising trendline around 2450.

Seoul Composite Index

Japan’s Nikkei 225 Index also retraced but the long tail on this week’s candle indicates solid support at 22000.

Nikkei 225 Index

Hong Kong’s Hang Seng continues in a strong bull trend, with the Trend Index respecting the zero line.

Shanghai Composite Index

China’s Shanghai Composite Index is consolidating above support at 3340. Bearish divergence on the Trend Index warns of selling pressure but this appears to be secondary in nature, warning of no more than a correction.

Shanghai Composite Index

India’s NSE Nifty Index is also in a bull trend, with the Trend Index respecting zero. Respect of the rising trendline is likely and would signal a fresh advance.

Nifty Index

Target 10000 + ( 10000 – 9000 ) = 11000

Moving to Europe, Dow Jones Euro Stoxx 600 shows a stronger correction, with bearish divergence on the Trend Index warning of selling pressure.

DJ Euro Stoxx 600

The UK’s Footsie displays a stronger bearish divergence and the index is likely to test primary support at 7200.

FTSE 100

The S&P 500 displays a strong bull trend but penetration of the rising trendline is likely to lead to a correction to 2500.

S&P 500

East to West: S&P 500 leads the bulls

Let us start in the East, with the canary in the coal mine. The Seoul Composite Index completely ignored the nuclear threat from its northern neighbor, surging in a strong primary up-trend.

Seoul Composite Index

Japan’s Nikkei 225 Index likewise ignored the threat of a nuclear DPRK, advancing strongly since breaking resistance at 21000.

Nikkei 225 Index

China’s Shanghai Composite Index is also advancing, albeit at a more modest pace.

Shanghai Composite Index

India’s NSE Nifty Index displays strong buying pressure, with Twiggs Trend Index oscillating above the zero line.

Nifty Index

Target 10000 + ( 10000 – 9000 ) = 11000

Moving to Europe, Dow Jones Euro Stoxx 600 broke resistance at 395 and is likely to test its 2015 high.

DJ Euro Stoxx 600

Despite BREXIT fears, the UK’s Footsie has recovered to test resistance at 7600. Breakout would offer a target of 8000*.

FTSE 100

* Target calculation: 7600 + ( 7600 – 7200 ) = 8000

The S&P 500 leads the pack. With Trend Index troughs above zero and barely a correction in sight, the index displays exceptional buying pressure. At some point the Fed will take the punch bowl away but the party is likely to continue in full swing until then.

S&P 500

East to West: Seoul and Footsie find support

A Twiggs Money Flow trough high above zero reflects strong buying support on the Seoul Composite Index. Breach of support at 2300 is unlikely but would signal a primary down-trend.

Seoul Composite Index

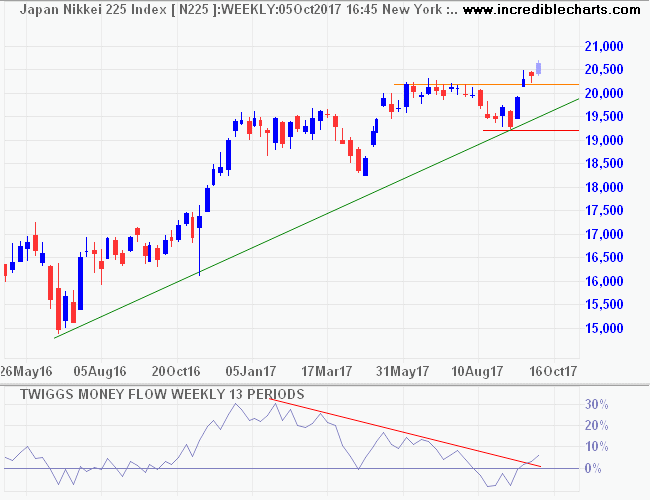
Japan’s Nikkei 225 Index broke resistance at 20200, signaling another advance.

Nikkei 225 Index

Hong Kong’s Hang Seng Index has been in a strong bull market since breaking resistance at 24000 early this year.

Hang Seng Index

India’s NSE Nifty Index displays strong buying pressure, with Twiggs Money Flow oscillating above the zero line. Breakout above resistance at 10000/10100 is likely and would signal another advance.

Nifty Index

Target 10000 + ( 10000 – 9000 ) = 11000

Moving to Europe, Dow Jones Euro Stoxx 50 is headed for a test of resistance at 3650. A big Twiggs Money Flow trough above zero signals buying pressure. Breakout is likely and would offer a target of 3900*.

DJ Euro Stoxx 50

* Target calculation: 3650 + ( 3650 – 3400 ) = 3900

The UK’s Footsie is rallying strongly after a bear trap at 7300. Often the strongest bull signals start with a bear trap or false break through support. breakout above 7550 would offer a target of 7900*.

FTSE 100

* Target calculation: 7550 + ( 7550 – 7200 ) = 7900

East to West: Seoul selling pressure

Declining peaks on Twiggs Trend Index and a tall shadow on this week’s candle warn of selling pressure on the Seoul Composite Index. Breach of support at 2300 would signal a primary down-trend.

Seoul Composite Index

Most other exchanges remain bullish, with Japan’s Nikkei 225 Index breaking resistance at 20200. Expect retracement to test the new support level. Respect would signal a fresh advance.

Nikkei 225 Index

China’s Shanghai Composite Index is retracing to test its new support level at 3300. Declining peaks on the Trend Index warn of medium-term selling pressure. Respect of support would confirm a primary advance.

Shanghai Composite Index

India’s NSE Nifty Index respected resistance at 10000/10100 and declining peaks on Twiggs Trend Index warn of medium-term selling pressure. Follow-through below the rising trendline would warn of a correction.

Nifty Index

Target 10000 + ( 10000 – 9000 ) = 11000

Moving to Europe, Germany’s DAX consolidated ahead of the elections. The Trend Index trough at zero indicates buying pressure and a test of 13000 is likely.

DJ Euro Stoxx 600

The UK’s Footsie retraced to test its new resistance level at 7300. Respect would confirm a primary down-trend. Declining Twiggs Trend Index peaks, especially below zero, signal selling pressure. Follow-through below 7100 would strengthen the bear signal.

FTSE 100

East to West

First, the canary in the coal mine, the Seoul Composite Index, found support at 2300. Follow-through above 2400 would be a bullish sign, suggesting a fresh advance.

Seoul Composite Index

Japan’s Nikkei 225 Index found support despite ICBMs flying overhead, rallying to test resistance at 20000. Recovery above 20000 is likely and would signal a fresh advance.

Nikkei 225 Index

China’s Shanghai Composite Index is retracing to test its new support level at 3300. Respect is likely and would confirm a fresh advance.

Shanghai Composite Index

India’s NSE Nifty Index is testing resistance at 10000/10100. Twiggs Trend Index oscillating above zero signals long-term buying pressure. Breakout is likely and would indicate a fresh advance with a long-term target of 11000*.

Nifty Index

Target 10000 + ( 10000 – 9000 ) = 11000

Moving to Europe, Germany’s DAX rallied off support at 12000, suggesting a fresh advance. Recovery of the Trend Index above zero is bullish. Breakout above 13000 would signal another primary advance.

DJ Euro Stoxx 600

The UK’s Footsie, however, broke support at 7300 on the back of BREXIT worries, warning of a primary down-trend. Twiggs Trend Index peaks below zero signal selling pressure. Follow-through below 7100 would confirm a bear market.

FTSE 100

Asian stocks rally, Europe follows

Asian stocks have started to rally and Europe is likely to follow. Canada faces stronger headwinds and is expected to struggle to break resistance at 900.

Starting near Korean epicenter of political tensions, the Seoul Composite Index remains bullish. Though breach of the rising trendline could change matters in an instant. No hint of panic selling….yet.

Seoul Composite Index

China’s Shanghai Composite Index finally broke through resistance at 3300, offering a target of 3500. The Trend Index oscillating above zero indicates long-term buying pressure.

Shanghai Composite Index

Japan’s Nikkei 225 Index encountered strong resistance at 20000 but a rounding top is a bullish sign. Recovery above 20000 is likely and would signal a fresh advance.

Nikkei 225 Index

India’s NSE Nifty Index is testing resistance at 10000. Twiggs Trend Index oscillating above zero signals long-term buying pressure. Breakout is likely and would indicate a fresh advance with a long-term target of 11000*.

Nifty Index

Target 10000 + ( 10000 – 9000 ) = 11000

In Europe, the UK’s Footsie, beset with BREXIT issues, still managed to respect support at 7300, avoiding a primary down-trend. Another test of 7600 is likely but breakout and another primary advance appear remote given the loss of momentum and selling pressure signaled by the declining Trend Index.

FTSE 100

Dow Jones Euro Stoxx 600 found support at the rising trendline, around 370. Recovery of the Trend Index above zero is likely. Follow-through above 380 would suggest another primary advance.

DJ Euro Stoxx 600

Moving to North America, Canada’s TSX 60 continues to consolidate in a narrow line below the former primary support level at 900. Declining Trend Index warns of long-term selling pressure. Breach of support at 880 is likely and would confirm a primary down-trend.

TSX 60