East to West: Time to take the punch bowl away

Crude oil is retracing and a Nymex Light test of $60/barrel would take some of the heat out of the commodities market. A rising rig count in the US may help to increase supply and ease oil prices.

Nymex Light Crude

Political tensions remain high, with the Turks bombing Kurd-controlled territory in Syria, Iran proxies in Yemen firing missiles at Saudi Arabia, North Korea showing no signs of caving to sanctions pressure over its nuclear weapons program, and Russia fomenting tensions in the Balkans between Serbia and Kosovo.

Stock markets shrugged off the usual conga-line of autocrats behaving badly, instead focusing on signs of a reviving global economy. South Korea’s Seoul Composite Index is headed for a test of resistance at its November high of 2560. Respect of the rising trendline is bullish but the latest Trend Index rally is weak and a bearish divergence may be forming.

Seoul Composite Index

Japan’s Nikkei 225 Index remains bullish. A Trend Index trough high above zero indicates strong buying pressure.

Nikkei 225 Index

China’s Shanghai Composite Index broke resistance at its November high of 3450 to signal another primary advance.

Shanghai Composite Index

India’s NSE Nifty Index is advancing toward its target of 11000*. Trend Index troughs above zero signal long-term buying pressure.

Nifty Index

Target 10500 + ( 10500 – 10000 ) = 11000

In Europe, the DJ Euro Stoxx 600 broke resistance at 396. Trend Index recovery above the declining trendline indicates buyers are back in control.

DJ Euro Stoxx 600

The Footsie met short-term resistance at 7800 and is likely to retrace to test its new support level at 7600. Trend Index recovery above the declining trendline again indicates buyers have taken control.

FTSE 100

Moving to the US, the Dow chart says it all. Investors continue to shrug off concerns about high valuations as the up-trend accelerates. The few corrections over the last 12 months have been both mild and of short duration. A rising Trend Index, with troughs high above zero, indicates strong buying pressure. It is important to remain objective, focus on the long-term, and not to get caught up in the euphoria. Heady gains like this inevitably lead to a sharp blow-off. The question is: when?

Dow Jones Industrial Average

Right now it seems the rocket has plenty of fuel, with tax cuts expected to stimulate both buybacks and new capital investment, while a falling US Dollar should boost US manufacturer’s competitiveness both at home and abroad. A sharp reversal could be many months away.

It’s time that the Fed took the punch bowl away, to calm things down before the party really gets out of hand.

East to West: Global stocks rally

In Asia, South Korea’s Seoul Composite Index found support at 2450 but be careful of a bearish divergence forming on Twiggs Trend Index. Reversal below zero would warn of a test of primary support at 2300.

Seoul Composite Index

Japan’s Nikkei 225 Index remains bullish. Trend Index troughs high above zero indicate strong buying pressure.

Nikkei 225 Index

China’s Shanghai Composite Index found support at 3250. Breakout above 3450 would signal a primary advance.

Shanghai Composite Index

India’s NSE Nifty Index broke resistance at 10500, signaling a fresh advance. Trend Index troughs above zero signal buying pressure. The immediate target is 11000*.

Nifty Index

Target 10500 + ( 10500 – 10000 ) = 11000

In Europe, the Footsie is advancing strongly after breaking through resistance at its June high of 7600. Trend Index is still declining but recovery above the declining trendline indicates buyers are taking control.

FTSE 100

Europe, represented by the DJ Euro Stoxx 600, remains weak. A declining Trend Index warns of selling pressure despite breakout above resistance at 396.

DJ Euro Stoxx 600

Moving to the US, the S&P 500 chart says it all. Investors continue to shrug off concerns about high valuations. The rising Trend Index, high above zero, indicates strong buying pressure. We need a correction fairly soon to prevent an accelerating up-trend leading to a blow-off.

S&P 500

Commodities are also advancing, led by stronger crude oil prices.

Nymex Light Crude

It’s about time that the Fed and other central banks took the punch bowl away, before the party really gets out of hand.

Crude consolidates

Crude is consolidating below long-term resistance. Nymex crude is consolidating between $55 and $60/barrel, the 2015 high.

Nymex Light Crude

Brent crude is consolidating between $60 and $65, some way below its 2015 high of $70/barrel.

Brent Crude

The primary trend in both cases is up, with no signs of an imminent change.

Crude resistance

Crude is running into resistance at $60/barrel after a strong advance over the last three months. Two retracements in quick succession suggest that the commodity is running into resistance as it approaches its 2015 high.

Nymex Light Crude

Gold rallies as Dollar falls

The greenback is weakening. The Dollar Index retracement respected resistance at 94, confirming a decline to test primary support at the September low of 91. Follow-through below secondary support at 93 would strengthen the signal.

Dollar Index

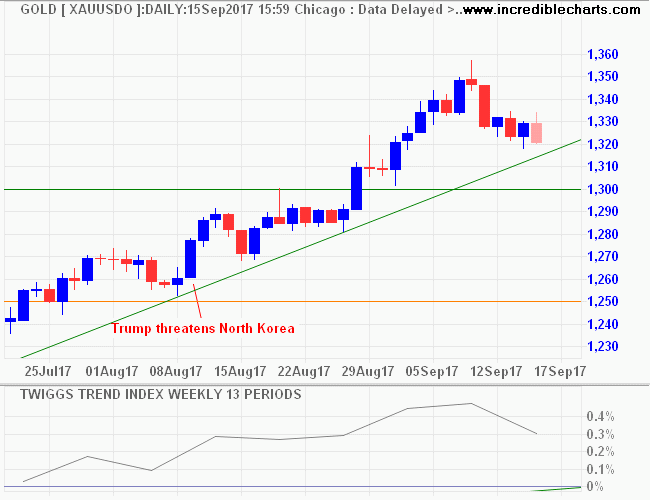
The falling Dollar strengthened demand for gold which is testing the band of resistance around $1300/ounce. Upward breakout is likely (Twiggs Trend Index holding above zero indicates buying pressure) and would target the September high of $1350. Breach of primary support at $1260 is most unlikely but would be a strong bear signal for gold.

Spot Gold

The All Ordinaries Gold Index is headed for a test of long-term resistance at 5000 in response to the falling Aussie Dollar and rising gold prices in USD.

All Ordinaries Gold Index

Gold and crude oil tend to rise and fall in unison over the long-term. The primary up-trend in crude prices improves the long-term outlook for gold.

Nymex Light Crude

Rising crude lifts all commodities?

Crude is rising, with Nymex Light Crude respecting its new support level at its former two-year high of $54/barrel, indicating a primary advance.

Nymex Light Crude

The general rule is that rising crude prices lift all commodities. Crude prices are a major factor in commodity prices due to the high energy costs of extraction (hard commodities), cultivation (soft commodities) and transport (both hard and soft).

The broad DJ-UBS Commodity Index is retracing but likely to respect the rising trendline, with a rally testing resistance at 90.

DJ UBS Commodity Index

Copper also shows some weakness at present but respect of primary support at 6400 would confirm the up-trend.

Copper Grade A

Iron ore is headed in the opposite direction, however, as the Chinese real estate market slows. But expect strong support between $48 and $54/tonne, especially if the rise in crude prices continues.

Iron Ore

Even gold prices tend to rise and fall in unison with crude over the long-term.

Crude retraces

Nymex Light Crude is retracing to test its new support level at the former two-year high of $54.50/barrel. Respect would confirm the primary advance.
Nymex Light Crude

Brent crude is similarly retracing, to test support around $60/barrel.

Brent Crude

Broad commodity prices are likely to follow crude, with the DJ-UBS Commodity Index heading for resistance at 90.

DJ UBS Commodity Index

Iron ore is more susceptible to cycles in the Chinese real estate market but is likely to respect primary support at $52.50/tonne.

Iron Ore

Even gold is likely to benefit in the long-term if crude prices rise.

Crude breakout warns of commodity rise

Most significant news of the week was Nymex Light Crude breaking resistance at its two-year high of $54.50/barrel, signaling a primary advance. Retracement that respects the new support level would confirm the up-trend.

Nymex Light Crude

The next major resistance level is at $60/barrel, shown on the 5-year chart below.

Nymex Light Crude

The breakout follows Brent crude’s earlier breakout above $55, signaling a primary up-trend.

Brent Crude

Crude prices are a major factor in commodity prices due to the high energy costs of extraction (hard commodities), cultivation (soft commodities) and transport (both hard and soft). Rising crude prices are likely to cause a broad rise in commodity prices, with the DJ-UBS Commodity Index testing resistance at 90.

DJ UBS Commodity Index

Iron ore is more susceptible to cycles in the Chinese real estate market but is likely to find support above $50/tonne if crude prices rise.

Iron Ore

Even gold would be likely to benefit as gold and crude prices tend to rise and fall in unison over the long-term.

Crude oil tests 2-year high

Nymex Light Crude is rising steeply, testing resistance at its two-year high of $54.50/barrel.

Nymex Light Crude

Breakout would signal a primary up-trend but I would wait for confirmation from a retracement that respects the new support level.

Rising crude prices would be a bullish signal for gold; the two tend to rise and fall together over the long-term.

Crude oil rising

Nymex Light Crude broke resistance at $52/barrel, signaling an advance to $54. Expect stronger resistance at $54 to $54.50, a 2-year high.

Nymex Light Crude

A primary up-trend in crude prices would be a bullish signal for gold. The two tend to rise and fall together over the long-term.

Dollar rally stalls, Gold bounces

Nymex Light Crude is still testing support at $50/barrel. Follow-through above $52 would signal another advance, with a target of $54/barrel. Reversal below $49 and the rising trendline, however, would warn of trend weakness. A primary up-trend would be bearish for the Dollar and bullish for gold.

Nymex Light Crude

The Dollar Index bear market rally found resistance at 94 and is now retracing to find support. Breach of primary support at 91 would signal another major decline. Respect, on the other hand, would suggest that a base is forming.

Dollar Index

Spot Gold underwent a deep correction but is now rallying as the Dollar stalls. Political tensions remain high, both within the White House and without, and the Dollar remains in a bear market. Breakout above $1300 would reflect strong upward pressure, suggesting another test of $1350. Retreat from $1300 is not necessarily bearish. Respect of support at $1250 would suggest that a base is forming. Breach of $1250, on the other hand, would warn that the primary up-trend that started in early 2017 is weakening.

Spot Gold

Target 1300 + ( 1300 – 1200 ) = 1400

Gold hurts as Dollar rallies

Nymex Light Crude respected its new support level at $50/barrel. Follow-through above $52 would signal another advance, with a target of $54/barrel. A primary up-trend would be bearish for the Dollar and bullish for gold.

Nymex Light Crude

At present the Dollar Index continues its bear market rally, testing resistance at 94. Breakout is fairly likely but expect another correction to test primary support at 91. After all, this is a bear market.

Dollar Index

Spot Gold is undergoing a deep correction in response to the Dollar rally. But political tensions are high and the Dollar is in a bear market. Respect of the rising trendline (around $1250) would signal another primary advance. Follow-through above $1350 would confirm.

Spot Gold

Target 1300 + ( 1300 – 1200 ) = 1400

Gold corrects as Dollar rallies

The Dollar Index continues to test resistance at its former primary support level of 93. This is a bear market rally. Rising crude prices are bearish for the Dollar and respect of resistance would confirm another decline.

Dollar Index

*Target: 93 – ( 103 – 93 ) = 83

Nymex Light Crude has advanced since breaking resistance at $50/barrel. Target for the primary advance is $54/barrel. Retracement to test the new support level remains likely but respect would confirm the up-trend.

Nymex Light Crude

Spot Gold continues in a primary up-trend. Political tensions are high and a weaker Dollar would drive another gold advance. A correction that respects the rising trendline would signal a primary advance. Follow-through above $1350 would confirm. A Trend Index trough above zero, indicating buying pressure, would strengthen the bull signal.

Spot Gold

Target 1300 + ( 1300 – 1200 ) = 1400

Gold finds support as crude oil advances

Nymex Light Crude broke through resistance at $50/barrel, signaling a primary advance with a target of $54/barrel. Expect retracement to test the new support level but respect is likely and would confirm the up-trend.

Nymex Light Crude

The Dollar Index is retracing to test its new resistance level at 93. Rising crude prices are bearish for the Dollar and respect of resistance is likely, which would confirm another decline. Twiggs Trend Index has started to rise, however, and recovery above 93, while less likely, would warn of a bear market rally.

Dollar Index

*Target: 93 – ( 103 – 93 ) = 83

Spot Gold found short-term support at $1290/ounce, overshooting the $1300 target. Political tensions are high and a weaker Dollar would drive another gold advance. Recovery of gold above its descending trendline and Twiggs Trend Index above zero would strengthen the signal. But breach of $1290 is as likely and would warn of a test of $1250.

Spot Gold

Target 1300 + ( 1300 – 1200 ) = 1400

Gold looks for support as Dollar retraces

Spot Gold is retracing to test support after a strong advance to $1350/ounce. Respect of the rising trendline would signal another strong advance but a stronger correction, respecting support at $1300 is more likely. The immediate target for another advance is the 2016 high of $1375. Rising Twiggs Trend Index indicates buying pressure. Breach of support at $1300 is unlikely at present.

Spot Gold

Target 1300 + ( 1300 – 1200 ) = 1400

Gold is supported by a weakening Dollar, with the Dollar Index retracing to test its new resistance level after breaking primary support at 92. Respect of resistance is likely and would confirm the long-term target of 83*.

Dollar Index

*Target: 93 – ( 103 – 93 ) = 83

Rising crude oil prices would also be bullish for gold, increasing inflationary pressure and also easing pressure on oil-producing states to sell off gold reserves accumulated when oil prices were high. Nymex Light Crude is testing resistance at $50/barrel. Upward breakout would suggest that the recent down-trend has ended — a bullish sign for gold.

Nymex Light Crude

Dollar fall buoys Gold

The Dollar Index ended weakly, breaking long-term support at 93. Declining Twiggs Trend Index warns of sustained selling pressure. Follow-through below 92 would confirm another primary decline, with a long-term target between 83 and 84*.

Dollar Index

*Target: 93 – ( 103 – 93 ) = 83

A weak Dollar is bullish for Gold. Spot gold is consolidating below resistance at $1300/ounce. Rising Twiggs Trend Index signals buying pressure. Upward breakout above $1300 is likely and would signal another primary advance, with a target of $1400*. Reversal below $1250 is unlikely but would warn of another test of primary support at $1200.

Spot Gold

Target 1300 + ( 1300 – 1200 ) = 1400

Always the wild card, crude is consolidating below resistance at $50/barrel. The weak Dollar is also bullish for crude oil prices. Declining Twiggs Trend Index warns of long-term selling pressure. That favors another test of support at $40/barrel, continuing the primary down-trend. But breakout above $50 and all bets are off.

Nymex Light Crude

Gold encounters resistance at $1300

The Dollar Index continues to test primary support between 92 and 93. Consolidation or a weak rally is likely but Twiggs Trend Index warns of long-term selling pressure. Breach of support would signal another primary decline, offering a long-term target between 83 and 84* — a bullish sign for gold.

Dollar Index

*Target: 93 – ( 103 – 93 ) = 83

Crude continues to test resistance at $50/barrel. Breakout would be bullish for gold but respect is more likely and would test primary support at $40/barrel.

Nymex Light Crude

Gold encountered strong resistance at $1300/ounce. Expect retracement to test support at $1270 and $1250. Reversal below $1250 remains unlikely.

Spot Gold

Target 1300 + ( 1300 – 1200 ) = 1400

Gold & Silver advance

The Dollar Index is testing primary support between 92 and 93. Expect consolidation or a weak rally but Twiggs Trend Index warns of sustained selling pressure. Breach of support would signal another primary decline, offering a long-term target between 83 and 84* — a bullish sign for gold.

Dollar Index

*Target: 93 – ( 103 – 93 ) = 83

Crude respected resistance at $50/barrel, suggesting another test of support at $40/barrel, continuing the primary down-trend. Twiggs Trend Index again warns of selling pressure. Breakout above $50 is now unlikely.

Nymex Light Crude

Gold is headed for a test of resistance at $1300/ounce, while a rising Twiggs Trend Index signals buying pressure. Breakout above $1300 is likely and would indicate another primary advance, with a target of $1400*. Reversal below $1250 is now unlikely but would warn of another test of primary support at $1200.

Spot Gold

Target 1300 + ( 1300 – 1200 ) = 1400

Silver broke through resistance at $17/ounce, a bullish sign for gold. Retracement that respects the new support level would strengthen the bull signal, indicating a test of the April high at 18.50.

Spot Silver