The Dollar is likely to continue weakening over the next few years according to analysis from a number of major banks. A falling Dollar would be a bull signal for gold investors.
The Dollar Index rallied over the past few days but is likely to encounter stubborn resistance at 90.50. Respect is likely and would signal another test of support at 88.50. Breach of support would warn of another primary decline.
* Target calculation: 91 – (95 – 91) =87
Gold lacks direction, ranging between 1310 and 1360, but that would change dramatically if the Dollar breaches support at 88.50. Breakout above $1360 would signal another primary advance, with a target of $1450*. Follow-through above $1375 would strengthen the signal.
* Target calculation: 1350 + (1350 – 1250) = 1450
The All Ordinaries Gold Index has been undermined by the strong Aussie Dollar. Further weakness of the greenback would help support commodity prices and the Aussie. But further gains on XGD remain likely and recovery above 5100 would signal another advance.
The Dollar weakened, with the Dollar Index testing support at 88.50. Respect of new resistance at 91 — the last primary support level — confirms the strong down-trend. Completion of another Trend Index peak below zero would further strengthen the signal.
* Target calculation: 91 – (95 – 91) =87
The extent of the Dollar’s fall is best illustrated against major trading partner China’s Yuan: a 9.5% fall in just over two years. And that is despite rising US interest rates and a $120 billion increase in China’s foreign reserves over the last year.
Gold is again testing resistance at $1350. Breakout would signal another primary advance, with a target of $1450*. Follow-through above $1375 would confirm.
* Target calculation: 1350 + (1350 – 1250) = 1450
The All Ordinaries Gold Index has been undermined by the strong Aussie Dollar. But recovery above 5000 would signal another advance.
Gold bounced off support at $1240/ounce, ending the week with a strong rally. Penetration of the descending trendline would indicate the down-trend has weakened, while breakout above $1300 would suggest another advance. Twiggs Trend Index close to zero still indicates hesitancy.
The greenback is weakening which is bullish for gold. Dollar Index reversal below 93 (and the rising trendline) would indicate another test of primary support at 91. A major Trend Index peak below zero would warn of another primary decline with a target of 87*.
* Target calculation: 91 – (95 – 91) =87
Australia’s All Ords Gold Index is headed for another test of long-term resistance at 5000. Breakout would signal a primary advance.
A weakening Aussie Dollar would strengthen demand for gold stocks. Respect of resistance at 77.5 US cents by the current bear rally would warn of a decline to test primary support at 73.5.
The greenback continues its bear market rally, assisted by the new tax bill and the December Fed rate hike. Breakout above resistance at 95 would signal a primary up-trend, a strong bear signal for gold, but the Dollar still has to overcome concerns over North Korea.
Gold found short-term support at $1240/ounce and recovery above the descending trendline would indicate that the down-trend is weakening. Breach of primary support at $1200 is unlikely but would be a strong bear signal, warn of a primary down-trend.
The All Ords Gold Index is also correcting. Breach of primary support at 4300 would warn of a primary down-trend.
But I expect this to be cushioned by further weakness on the Aussie Dollar.
Helped in part by a declining yield differential between Australian and US government bonds.
Re-published with kind permission from Macrobusiness.
Key Points:
GDP growth has lifted in 2017 and the labour market has tightened.
Our base case has these trends continuing over the next two years, but there are a number of downside risks.
The ability of monetary policy to support the economy in the event of a negative shock is more limited than in the past thereby exacerbating the potential impact that any negative shock may bring.
On some important metrics it’s been a reasonably good for year the Australian economy. The labour market has tightened courtesy of very strong employment growth and real GDP growth has lifted. At the same time, nominal GDP growth has been buoyant due to firmer commodity prices when compared to a year earlier. Wages growth, however, remains soft and real wages are barely in positive territory.
The house view is that the improvement in the labour market continues over the next two years and the unemployment rate should continue to grind lower. But there are plenty of risks that would change the outlook if they were to materialise.
This note discusses some of the key global and domestic risks to the Australian economy. It begins with an outline of CBA’s base case for the economy over the next two years before delving into some of the potential risks. This is not an exhaustive list, but rather it covers a few areas that the author considers to be the most acute risks to our central scenario. They are: (i) the capacity to respond to a negative shock with monetary policy (and to a lessor extent fiscal policy), (ii) a solid fall in commodity prices; (iii) a sharp correction in dwelling prices; (iv) a policy “mistake”; and (v) a fall in net migration via a policy change.
CBA’s central scenario
CBA’s base case for the economy over the next two years is a benign one. It is broadly similar to the RBA’s forecast profile for the economy which is also not dissimilar to the consensus view.
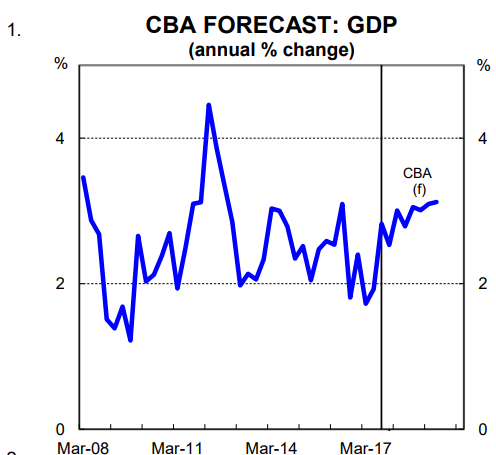
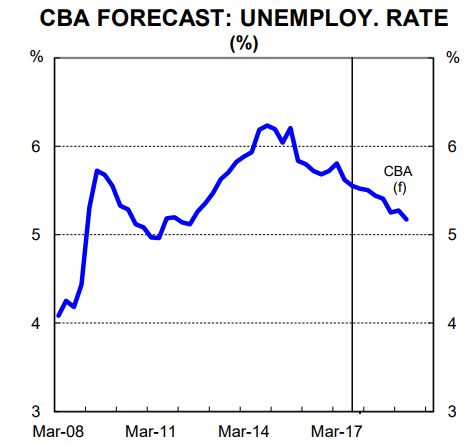
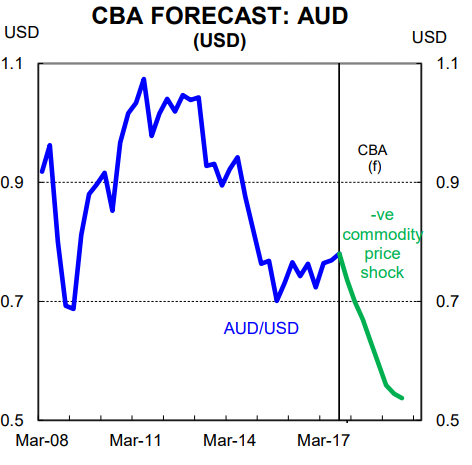
On the key components, we see output growth continuing to lift to a pace of around 3%pa in 2018 (chart 1). We put potential growth at 2¾% (population plus productivity growth) which means our forecast profile has a gradual decline in the unemployment rate as spare capacity recedes (chart 2). In 2018, most of the key components of the economy are expected to contribute to growth, with dwelling investment the exception.
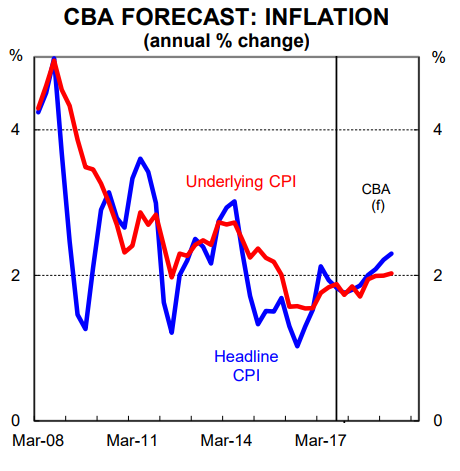
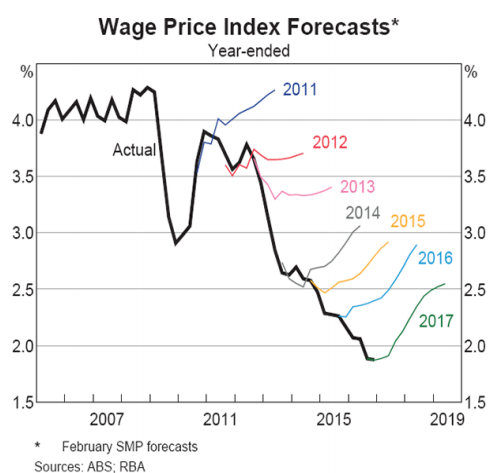
Our base case has inflation remaining soft due to elevated slack in the labour market which is suppressing wages growth. We have core inflation tracking at the bottom of the RBA’s target band (chart 3). This means that a rate rise still looks a long way off. We have commodity prices drifting a little lower which means that we expect the terms-of-trade to ease over the next few years, but to remain above its trough in early 2016. As a result, nominal GDP growth should step down.
We don’t explicitly forecast dwelling price growth. But the most likely outcome, in our view, is for dwelling price growth to slow and converge with household income growth (i.e. a low single digit annual growth rate). Such an outcome would also represent a best case outcome from a financial stability perspective.
We expect housing credit growth to continue to slow driven by a further easing in lending growth to investors.
The capacity to respond to a negative shock with monetary and fiscal policy
Monetary policy: While strictly speaking not a risk to the economic outlook per se, in many ways the reduced capacity to respond to a negative shock, particularly via monetary policy, is the biggest risk to the economy outlook.
Over the past 30 year the interest rate lever has been used to smooth out business cycles. When output and employment growth have fallen and/or the outlook for inflation has been lowered, interest rates have come down.
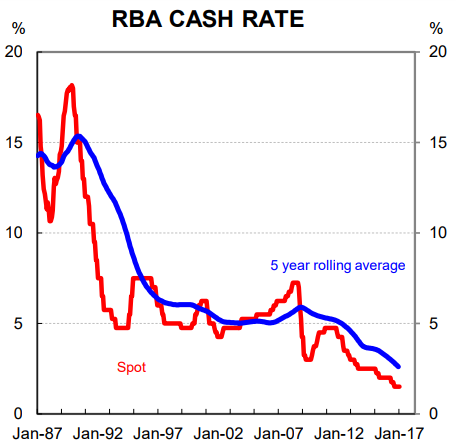
Conversely, the policy rate has been raised when it’s been necessary to slow the pace of growth and inflation in the economy. That process has worked relatively well. But it may have a limited shelf life because it’s required a structural decline in interest rates to support the economy over the past 30 years (chart 4).
The amount of fire power the central bank has on the cash rate front is effectively the difference between the current policy rate and the lower bound. We aren’t at the lower bound yet. But with a current cash rate of 1.5% we are close. In our view, a policy rate of around 0.75% would probably be the lower bound in Australia, which is higher than the lower bound of many other advanced and bigger economies. In the Eurozone and Japan, for example, policy rates have gone negative. But these regions run current account surpluses which probably gives them greater scope to take rates down without causing a massive fall in their currencies (chart 5). In Australia, it may not be possible to cut the cash rate below 0.75% because the current account deficit has been sizeable in the past as a share of GDP and must be funded (note that the current account deficit would blow out if there was a negative commodity price shock). As a result, there may only be a few rate cut ‘bullets’ left if we are right. The RBA will hope that if/when the next shock arrives the cash rate is a fair bit higher than it is today to allow them scope to cut and provide stimulus to the economy. But while the cash rate sits at 1.5% the economy is more vulnerable than usual to a shock.
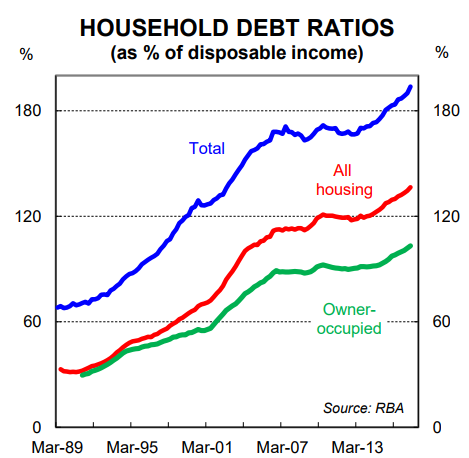
The limited capacity to stimulate the economy further via rate cuts means that the ability of household leverage to increase further is also hamstrung. As interest rates have come down over the past 30 years the stock of household debt relative to income has risen (chart 6). That is because households have been able to borrow more for a given level of income. As a result, Australia has
the second most indebted household sector in the world.
In previous downturns rate cuts both encouraged and made it possible for households to increase debt relative to income. That debt initially went into higher dwelling prices, but ultimately the new credit created found its way into consumption. But with very little capacity to take interest rates lower and with the household sector already very stretched, the consumer is not going to absorb the next economic shock by borrowing through it.
Fiscal policy: There is some scope to stimulate the economy via fiscal policy if/when a negative shock arrives. In fact, the Government’s balance sheet looks in a much better condition than most other advanced countries when assessed on a debt to GDP basis. But we should not get too carried away because Australia has a structural deficit which means debt to GDP will rise quite quickly if/when the next negative shock arrives. From here, any downturn in the economy would almost certainly see the Government’s triple A credit rating stripped. While there is some conjecture over the precise implications of losing the triple A, its loss would certainly carry some weight from a symbolic perspective given it’s been the proud boast of successive Treasurers.
A commodity price shock
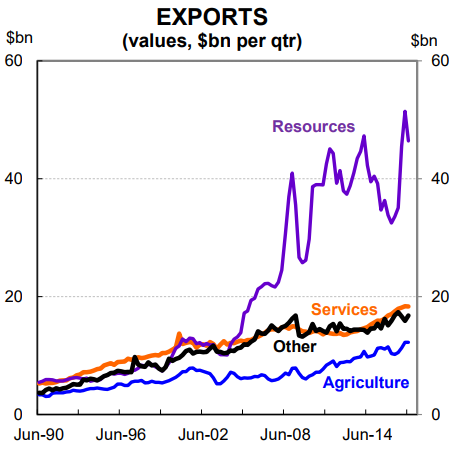
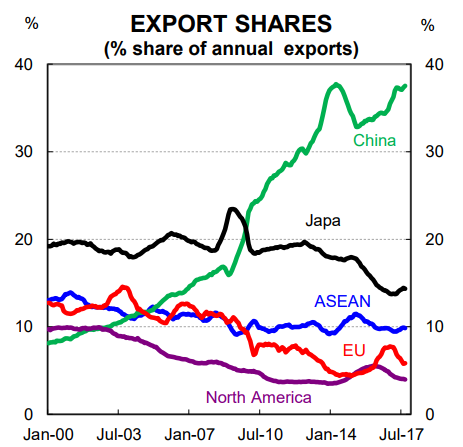
From an external perspective, a commodity price shock carries the greatest risk to the Australian economy. Australia continues to be heavily reliant on commodities for its resource revenue (chart 7). And a huge chunk of our exports go to China (chart 8). As such, the biggest threat to commodity prices is a slowdown in China that would lead to lower investment growth (or possibly a fall in investment). Such a slowdown could occur it if the Chinese authorities accept a lower level of output growth for the sake of financial stability given the rapid build-up of corporate debt. It could also happen if a greater emphasis is placed on delivering growth through services rather than investment. And it could of course come via a China hard landing (a Trump-led lift in tariffs in the US, for example, could be the trigger). In any event, commodity prices get hit and that would have implications for the Australian economy.
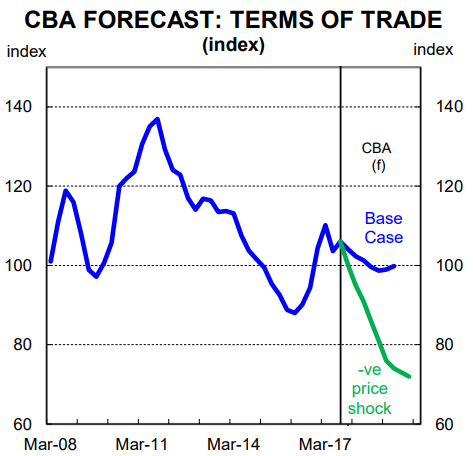
A sizeable fall in commodity prices would pull Australia’s terms-of-trade substantially lower. Roughly speaking, a 40% fall in commodity prices would see Australia’s terms-of-trade fall by 30% (chart 9). This is an illustrative example, but it is also represents a plausible outcome if there was a material slowdown in investment growth in China. In such a scenario the AUD could fall to the low-mid US 50 cent mark (chart 10).
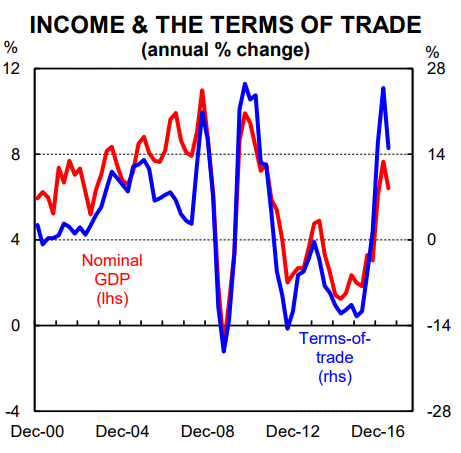
A terms-of-trade shock would weigh on income across the economy more broadly given the strong correlation between commodity prices and nominal GDP (chart 11). In addition, Government revenue would be hit because of the relationship between the terms-of-trade and the tax take. Finally, unemployment would rise. While a lower AUD would provide some support to the economy, the limited capacity of monetary policy to absorb a commodity price shock from here would see the unemployment rate rise faster than would otherwise have been the case.
The capacity of wages growth to slow further from here is also limited in the event of a commodity price shock. That is because wages growth is already at record lows and wages growth is sticky downwards. A fall in wages growth was able to cushion the most recent terms-of-trade shock (late-2011 to early 2016) because growth in wages slowed in line with the weakness in commodity prices. This helped to support the labour market and keep the unemployment rate from rising as much as it otherwise might have. But this time, a fall in wages growth will not be able to absorb the shock to the same extent given wages growth is already so low.
A sharp correction in dwelling prices
The single biggest risk to the domestic outlook looks to be a sharp correction in dwelling prices. In our view, this carries a greater risk to the real economy than it does to financial stability given the banking system is well capitalised.
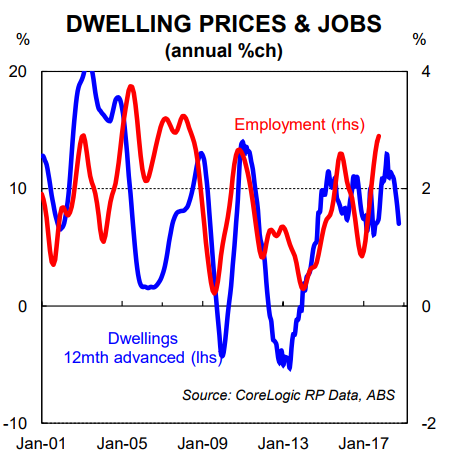
There is a commonly held belief in Australia that the main trigger for a fall in dwelling prices is a rise in unemployment. This seems logical because rising unemployment would generally be associated with a lift in mortgage delinquencies which would put downward pressure on prices. But the data suggests that employment is more likely to lag changes in dwelling prices rather than lead (chart 12). The obvious question to then ask is why? We attribute the answer, in part, to the wealth effect and the recent track record of monetary policy in smoothing out the business cycle.
In periods when employment growth is slowing, the RBA is generally easing policy. When this is occurring, as long as the RBA can fend off a recession, falling interest rates tend to push up dwelling prices via cheaper credit which in turn encourages spending and supports employment growth. Of course, it’s a different story if employment growth falls too fast and unemployment rises sharply. But so far, at the national level, this hasn’t happened since the recession of the early 90s.
The risk of a material correction in dwelling prices looks higher now than it has been for a long time given: (i) the incredible lift in dwelling prices over the past five years; (ii) mortgage rates are probably unlikely to go lower and indeed can’t go much lower; (iii) household debt to income is at a record high; and (iv) dwelling supply is in the process of lifting quite significantly in some jurisdictions.
A soft correction in dwelling prices would probably have no material negative impact on the labour market. But there is a risk that a hard correction in prices (a fall of 20% or more) would lead the economy into a downturn via the wealth effect (i.e. the notion that changes in demand are influenced by changes in the value of assets). Since income to one person comes via the spending of another, there is a risk that falling home prices leads households to put the brakes on spending which ultimately drags consumption and employment growth lower.
A policy “mistake”
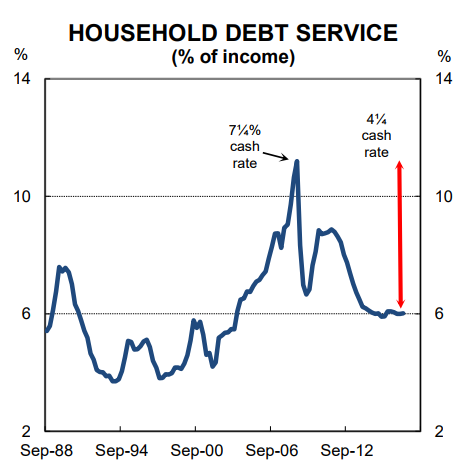
We consider a policy mistake by the central bank to be a risk to the economy given how much debt the household sector is carrying. Specifically, if the RBA hikes too early it could derail the improvement in the labour market that has been underway over the past two years. The record level of debt being carried by the household sector means that interest payments as a share of income will rise quickly if/when rates move higher (chart 13).
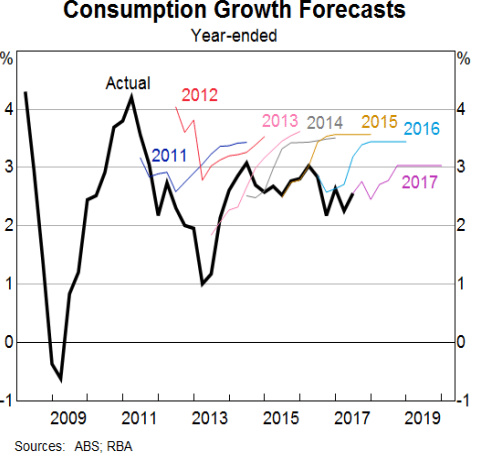
We consider a policy mistake to be a risk because the RBA has been overly bullish on wages and the consumer over the past five years (charts 14 & 15).
The apparent bias in their forecasts towards a lift in wages and consumer spending means there is a risk that they hike too early if/when wages growth starts to rise.
Here we note that the RBA puts the neutral cash rate at 3.5% which is 200bpts above current settings (this is higher than our estimate of 3.0%). This means that on their own numbers, the RBA would be tightening to 3.5% if it thought the economy was on a sustained path to full employment and inflation at the mid-point of their target band. That to us looks too aggressive and therefore
there is a risk that the central bank hikes too early or too quickly.
A change in immigration policy
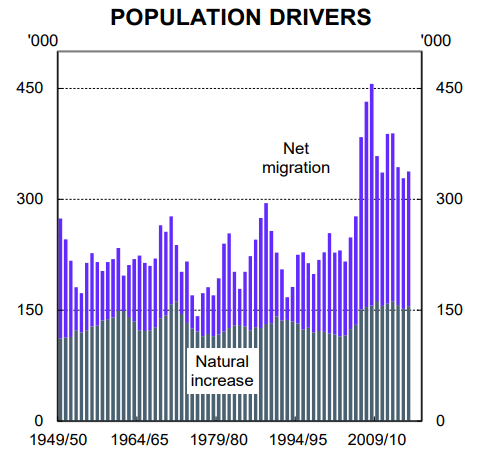
Australia’s population growth rate is significantly higher than most other OECD countries. Australia’s population grew by a strong 1.6% (i.e. 373k) in 2016. Net overseas migration accounted for 56% of that increase (chart 16).
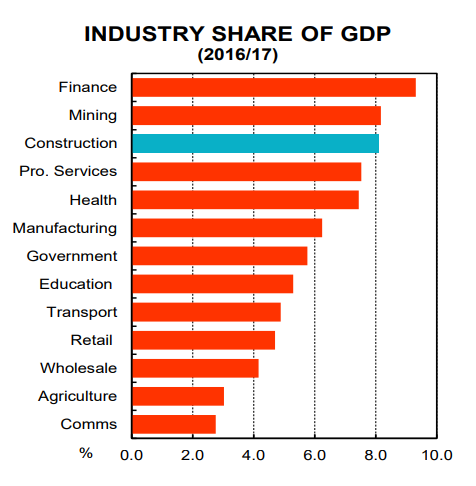
A strong population growth rate boosts the potential growth rate of the economy (not output per person, however) as well as puts upward pressure on dwelling prices through stronger demand for housing. It also, over time, alters the industry composition of the economy (chart 17).
The construction sector in Australia, for example, is proportionately bigger than the construction sector in most other advanced economies because strong growth in people means that more needs to be built – dwellings, roads, schools, hospitals, ports etc. Finally, at the margin, a strong population growth rate at a time when there is labour market slack is likely to be putting downward pressure on wages as workers from offshore add competition to domestic labour.
At present, both major sides of politics (i.e. the Liberal-National Coalition and the Labor party) support maintaining a high permanent migrant intake every year. But there is a risk that one of the major parties opts for a different policy stance. The example here is to be found in New Zealand where there has been a change in immigration policy following the recent election outcome that means migration should drop substantially over the next few years. As a result, a change in immigration policy cannot and should not be ruled out in Australia.
A material reduction in net migration to Australia would increase the risk of a fall in dwelling prices as well as weigh on total output growth (not GDP per capita) and negatively impact the construction sector. But it would also likely put upward pressure on wages growth by reducing the pool of workers in many occupations. In that context, it’s not so much a downside risk, but rather one that would see a shift in the economic outlook that would have both winners and losers. From a policy perspective it’s about assessing whether there is a net societal benefit. But that’s a question for another day.
The Aussie Dollar is tanking, falling from a September high of 81 US cents to below 76 US cents. Test of support at 73.50 is likely.
The All Ords Gold Index ($XGD) responded to the weakening Aussie Dollar, despite a lackluster performance from gold. Breakout above 5000 would signal a new primary advance, offering a target of 5650*.
The Dollar continues to strengthen, with the Dollar Index testing short-term resistance at 95. Another rate rise from the Fed in December would strengthen the Dollar further. Medium-term target for the extended rally is 97.
Spot Gold is under selling pressure, with the Trend Index declining to zero, and is likely to test support at $1260/ounce. Breach of support would warn of another decline, with a target of $1200.
But the All Ords Gold Index ($XGD) is rising, headed for a test of resistance at 5000. Breakout would signal a new primary advance.
…Largely because the AUD price of gold is rising …as the Australian Dollar weakens. There are still signs of resistance though, with the Trend Index unable to cross above zero. Reversal below $1620 would be a strong bear signal.
The Aussie Dollar broke support against the US Dollar at 77 cents, warning of a decline to test long-term support between 71.50 and 72.00.
Iron ore continues to test new resistance at $62/tonne. Respect would warn of a test of primary support at $53. Declining Twiggs Trend Index indicates selling pressure.
The ASX 300 Metals & Mining index fared better, testing resistance at its three-year high of 3300. But the index is likely to follow iron ore lower. Breach of support at 3100 would warn of a decline to 2700.
The ASX 300 Banks index retreated from resistance at 8800. Respect warns of another test of primary support at 8000.
If banks and miners are both headed in the same direction, the index is sure to follow.
The ASX 200 continues to test resistance at 5900. Follow-through above 5920 would be a strong bull signal, indicating an advance to 6000. Reversal below 5880 would suggest retracement to test the new support level at 5800 (top of the narrow ‘line’ formed over the last four months). Twiggs Money Flow reversal below zero would be a bearish sign.
Despite the falling Dollar and iron ore, the present outlook continues to favor the bull side.
Iron ore is falling in a sharp, typical bear market decline since it penetrated its rising trendline. A test of the June 2017 low at $53 is now likely.
The ASX 300 Metals & Mining index broke support at 3200 and looks set to test 3000. But respect of 3000 would confirm the long-term up-trend.
The ASX 200 continues to test support at 5650, in the narrow ‘line’ formed over the last four months. Twiggs Trend Index peaks below zero warn of selling pressure. Breach of support is likely and would signal a primary decline. Wait for confirmation from a breakout.
The ASX 300 Banks index is testing resistance at 8500 after a bear market rally. Respect would be a bearish sign and breach of 8000 would signal a primary down-trend. Recovery above 8800 is unlikely at present but would complete a double-bottom reversal.
Banks and Mining have so far counter-balanced each other, with miners rallying when banks fall and banks rallying when miners fall. Breakout of the ASX 200 from its narrow line is likely to occur when both banks and miners move in the same direction. Down is more likely at present.
Jens Meyer at the AFR says that a stronger Dollar and low inflation are likely to prevent the RBA from raising interest rates for some time:
Inflation is expected to remain below the Reserve Bank’s comfort zone when second-quarter CPI data is unveiled on Wednesday. Despite a jump in vegetable prices due to damage caused by Cyclone Debbie, economists predict consumer prices rose just 0.4 per cent over the second quarter and 2.2 per cent over the year.
More importantly for the central bank, ongoing softness in wages growth is tipped to have kept a cap on the less volatile core inflation, coming in at 0.5 per cent over the quarter and 1.8 per cent over the year, below the Reserve Bank’s target band of 2 to 3 per cent.
Rising iron ore prices helped the Aussie Dollar break long-term resistance at 78 cents, testing 80 against the greenback. This goes against the wishes of the RBA who need a weaker Dollar to assist exports and boost import substitution.
But the RBA is in a cleft stick. It cannot lower rates in order to weaken the Dollar as this would encourage speculative borrowing and aggravate the property bubble. It also can’t raise rates when inflation is low, the Aussie Dollar is strong and the economy is weak. Like Mister Micawber in Charles Dickens’ David Copperfield, the RBA has to sit and wait in the hope that something turns up.
Strange week on the ASX, with strong jobs numbers from the ABS causing a surge in the Aussie Dollar and a more optimistic outlook on the ASX.
But Iron ore continues to fall, headed for a test of 50.
The ASX 300 Metals & Mining index respected resistance at 3000 and is headed for a test of primary support at 2750. Breach would confirm the primary down-trend.
The ASX 300 Banks index respected resistance at 8500 and is likely to test primary support at 8000. Again, breach would confirm the primary down-trend.
The ASX 200 has formed a broadening wedge consolidation, in a down-trend. Declining Twiggs Money Flow indicates some selling pressure. Expect a test of primary support at 5600. Again, breach would warn of a primary down-trend. But a failed swing (that respects 5700) would warn that all bets are off and the index may be preparing for a rally.
And the broader DJ-UBS Commodity Index is testing support at 82. Breach would signal a decline to test the 2015 low at 74.
But the Aussie Dollar rallied Friday, the large engulfing candle suggesting another test of resistance at 75 US cents.
Miners finished strongly, with the ASX 300 Metals & Mining index reflecting short-term buying pressure. 13-Week Twiggs Money Flow recovered above zero.
The ASX 200 is testing resistance at 5800. A 21-day Twiggs Money Flow trough above zero indicates medium-term buying pressure. Breakout above 5800 is likely and would suggest another test of 5950/6000.
Banks also rallied, with the ASX 300 Banks index headed for a test of 8500. Expect strong resistance.
Perhaps this UBS report had something to do with it.
I believe that the latest rally is a secondary reaction and that the ASX is headed for a down-turn, with miners and banks leading the way. But it’s no use arguing with the (ticker) tape.
A prudent speculator never argues with the tape. Markets are never wrong, opinions often are.
The Aussie Dollar met resistance at the former support level of 75 US cents, with a tall shadow on Tuesday’s shooting star candlestick pattern. Respect of resistance is likely and would warn of another test of support at 73.50. Breach of support would offer a target of 72, putting pressure on ASX stocks as international investors retreat.
The Aussie tends to take its direction from commodities. At present iron ore displays a weak rally that coincides with the rally on AUDUSD. Reversal through support at 60 is likely, and would warn of a decline to 50.
Broad commodity indexes like the DJ-UBS Commodity Index are consolidating in a rectangle, between 82 and 90 on the chart below. Commodities have been trending lower since 2011, as shown yesterday. Breakout above 90 is unlikely but would signal a primary up-trend. Breach of support is more likely and would indicate a decline to test support at the January 2016 low, between 72 and 74.
The big banks fell sharply on news of a new levy on bank liabilities in the latest budget. At this stage the ASX 300 Banks Index merely shows a secondary reaction. Breach of 8500, however, would signal a primary trend reversal, offering a medium-term target of 8000*.
* Target: 8500 – ( 9000 – 8500 ) = 8000
Resources stocks compensated, with the ASX 300 Metals & Mining Index rallying to test resistance at 2850/2900. Breakout is unlikely given the weak lead from iron ore. Reversal below 2700 remains likely and would strengthen the bear signal for resources.
Iron ore formed a bearish consolidation above support at $60. Breach would offer a short-term target of $50*.
* Target: 60 – ( 70 – 60 ) = 50
Selling of the Aussie Dollar continues, with a medium-term test of primary support at 71.50/72.00 now likely.
Consolidation of the ASX 200 above support at 5800 is a bearish pattern. Breach would signal a correction to test primary support at 5600*. Twiggs Money Flow still indicates long-term buying pressure and only a fall below zero would warn of a reversal.
The yield differential between 10-year US and Australian government bonds has shrunk to less than 30 basis points, the tightest in about 15 years, as the US engages in monetary tightening while the RBA appears set to keep rates steady at 1.5 per cent.
….This should be a serious concern for Australian policymakers, TD Securities’ chief Asia-Pacific macro strategist Annette Beacher told The Australian Financial Review, as many foreign investors are primarily attracted to the high-yield status of the local currency.
The Aussie Dollar has attracted investors over the last decade primarily because good fortune in avoiding a post-GFC recession enhanced Australia’s reputation as a stable economy. But the Aussie is still a commodity currency prone to boom-bust cycles. Dodging the 2008/2009 bullet was more a matter of luck than of skillful management of the economy. Without China’s massive post-GFC stimulus the Australian economy would have been smashed — along with the housing bubble — and the big four banks would have gone to the wall (or more likely been rescued by a government bailout). And the Aussie would be trading close to 50 cents, which ironically, despite the massive shock, may have put the economy in a stronger (and more realistic) position than it is today.